If you are already tracking scans in QRCodeChimp, you are halfway there. The next step is understanding what people do after they land on your page. Do they tap “Call now,” “Order online,” or that tiny link to your catalogue that you spent hours designing?
That is where link click analytics comes in. QRCodeChimp now lets you see clicks for every individual button or link on supported page type solutions such as Business Page, Social Links, Multi URL, forms, catalogs and similar components.
This article walks through how link click analytics works in QRCodeChimp, how to find your top performing links and how to turn those insights into better campaigns.
What is link click analytics in QRCodeChimp
In QRCodeChimp, link click analytics records how many times users tap on each button or link after scanning your QR code. The system captures these link level clicks along with scan time, location, device type and other basic analytics whenever someone scans a trackable (dynamic) QR code.
For supported page based solutions, the analytics view now shows:
- Total link clicks per link or button on the page
- Link-level metrics at the individual QR level
- The same metrics rolled up at folder and account level so you can compare links across campaigns and teams
Think of it as x-ray vision for your landing page. Instead of guessing which call to action works, you see the exact links people choose.
Why top-performing links matter
Scan counts tell you if people are interested in your QR code. Top-performing link analytics tells you what they care about.
With link-level data, you can:
- See which CTAs pull most of the clicks on your Business Page, multi-link page, catalog, or digital business card
- Spot links that get very few clicks and may need a better label, design, or placement
- Compare intent across locations, campaigns, or time periods by looking at link clicks next to scans and other metrics in the analytics dashboard
For example, if a QR code on your product packaging links to a page with “Product details,” “How to use,” and “Claim warranty,” link-click analytics quickly show which action most buyers take. That is your top-performing link and your clearest signal about what users want in that moment.
Where to see link click analytics
Link click analytics lives inside the same analytics dashboard you already use for scans, locations, and devices.
You can access it in three main places.
1. Individual QR codes
From the Dashboard, find your QR code in the Individual or Bulk QR list and click “View Scan Analytics.” For supported page type solutions, the analytics view includes a section that lists link clicks for each link or button.
Here you see how every CTA on that particular page performs.
2. Folder level analytics
If you organize QR codes into folders, open “Folders” in the sidebar and select “View Scan Analytics” for a folder. Folder analytics aggregates metrics for every QR inside that folder, including link clicks where supported.
This is useful when one campaign spans several QR codes. You see which types of links work across the full set.
3. Account-level analytics
From the Dashboard sidebar, click “Analytics” to see an account-wide view of your performance for a chosen timeframe. In addition to metrics such as total scans, unique scans, top QR codes, and geo analysis, the dashboard includes link-click analytics and contact saves, where applicable.
This is where you can answer questions like, “Across all our campaigns this month, which action did people click the most after scanning?”
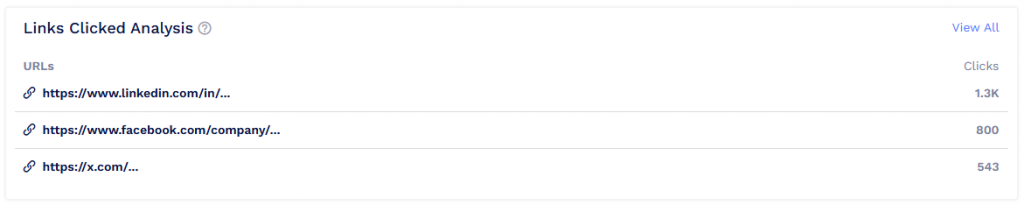
How to read the top-performing links report
Once you open analytics for a QR, folder, or your account, you will see a block that lists all links related to that context, each with its click count. For multi-link pages or Business Pages, this typically means every visible button or link component on the page.
Here is how to interpret what you see:
- High clicks on a link
This is a winner. It is likely that the message, placement, and promise of that CTA align with users’ expectations after scanning. - Medium clicks on several links
Your audience is split. They find value in multiple options. You may want to segment campaigns or create more focused page versions. - Very low clicks on a link
The link might be buried too deep, poorly labeled, or irrelevant to the audience scanning that QR code. - Clicks vs scans
If a QR code receives many scans but total link clicks are low, the page may not align with the scan intent. You might be creating curiosity with the QR but losing visitors once they land.
Taken together with other analytics, such as total scans, timeline analysis, and top locations, link-click data tells a complete story.
Turning top-performing link data into action
Good analytics leads to action. Here are practical ways to use your top-performing link insights inside QRCodeChimp.
Reorder and highlight winning links
If link click analytics shows that one CTA dominates, adjust your page layout so that this link appears higher on the page, gets more visual weight, or is repeated in key sections. QRCodeChimp’s page builders allow you to move, hide, and customize components on Business Pages, PDF galleries, and other solutions, so you can align the layout with what the data is telling you.
Fix or retire low-performing links
Links with very few clicks may need a clearer label or a stronger promise. You can:
- Rewrite the CTA text to be more specific
- Change icons or button style
- Move the link higher or closer to your primary content
- Remove it entirely if it is not essential
Each small change becomes a mini test. You can then revisit link-click analytics to see whether clicks improved.
Standardize winning CTAs across campaigns
If a particular link like “Order online,” “Book a table,” or “View catalog” consistently appears at the top of your link click list across various QRs, standardize that wording and placement in all related campaigns. Real examples in QRCodeChimp content show cafes, retailers, and catalog-based brands using link-level clicks to learn that some actions, like online orders or a specific product group, attract most clicks and then reshaping their pages around that insight.
Pair link clicks with Google Analytics
For deeper attribution, you can connect QRCodeChimp pages with Google Analytics and use UTM parameters. The QR code scan captures link-level clicks and forwards users to URLs that GA can track for pageviews, conversions, and revenue.
This way, “top performing link” no longer means only “most clicked” but “most sales” or “most signups” as well.
Best practices for using link click analytics
To get the most value from top-performing link metrics, set things up thoughtfully.
- Keep link labels human-friendly: Write labels that clearly state what happens after the click. For example, “Download brochure,” “Book a demo,” or “See menu” are easier to understand than vague single-word links.
- Limit choices on key pages: If your analytics show that most scans end up on a page with too many CTAs, consider trimming the list. Fewer, more focused options often mean stronger clicks on the links that actually matter.
- Use folders as campaigns: Group related QR codes in folders that mirror campaigns, regions, or product lines. Folder-level analytics, including link clicks, then gives you one place to compare performance across those QRs.
- Share and export data with your team: QRCodeChimp allows you to share analytics for individual QR codes through public or restricted links, and to export tracking data in Excel for further analysis if you are on an eligible plan.
- Review link clicks on a schedule: Combine daily or weekly analytics reports with regular check-ins on link-click data in an email. This keeps everyone aligned on which CTAs are currently winning and where optimization is needed.
Final thoughts
Top performing link analytics in QRCodeChimp shifts your focus from “How many people scanned my QR code?” to “What did they actually do after the scan?”
By tracking link-level clicks at QR, folder, and account level, you get a clear picture of which CTAs work, where users lose interest, and how different campaigns compare. Combined with dynamic QR codes, robust scan analytics, and optional Google Analytics integration, this feature gives you everything you need to refine your pages, strengthen your offers, and make each scan count a little more.
Use your next analytics check-in to look past the scan totals and spend a few extra minutes on the link click section. Your top performing links are already telling you what your audience wants. All you need to do is listen and adjust.
Frequently asked questions
What counts as a link click in QRCodeChimp analytics?
Whenever someone scans a trackable QR code that points to a supported page type and then taps a button or link on that page, the system records a link-level click for that specific element, along with other scan data such as time, location, and device type.
Which QRCodeChimp solutions support link click analytics?
Link click analytics works with component-based, page-type solutions where users can interact with multiple links, such as Business Page, multi-link pages, catalogs, forms, and similar layouts. QRCodeChimp also records link-level clicks and contact saves for digital business cards where relevant.
Do I need dynamic QR codes to track top-performing links?
Yes. Only dynamic QR codes are trackable. When you use dynamic codes with QRCodeChimp, every scan is logged in the analytics dashboard, including link-level clicks for eligible pages. Static QR codes do not support this type of tracking.
Can I see the top-performing links for an entire campaign, not just one QR?
You can. Since link click analytics is available at individual QR, folder, and account levels, you can use folders as campaign buckets and then check which links are most clicked across all QRs in that folder. The account view helps you spot overall winners across everything you run.
How often is link click data updated?
QR code tracking in QRCodeChimp works in real time. As soon as a user scans a dynamic QR code and taps a link on a supported page, the analytics dashboard reflects updated scan and click data, which you can also see through integrated tools like Google Analytics if configured.
How do I connect link-click analytics to conversions or sales?
Use QRCodeChimp’s integration with Google Analytics and add UTM parameters to your main links. Link click analytics shows which links were clicked. Google Analytics then tracks what happens after that click, such as purchases or signups. Together, these tools let you identify which links not only get attention but also drive measurable results.
You may also like
How to Ensure Instant Student Access to Recorded Lectures?
Learn how to give students instant access to recorded lectures using dynamic QR codes. Reduce LMS friction, improve findability, and boost engagement.
When Excel Broke: How QRCodeChimp Simplified Digital Business Cards for a Fast-Growing IT/ITES Enterprise
Discover how a fast-growing IT/ITES enterprise replaced Excel uploads with QRCodeChimp’s form-based automation to create branded digital business cards faster, with HR control.
Simplifying Document Access in Real Estate with QR Codes
Learn how QR codes simplify real estate document access. Share brochures, disclosures, and closing files securely with dynamic, trackable QR codes.
How to Use QR Codes for Study Materials, Syllabus, and Assignments
Learn how to use QR codes for education to share syllabi, assignments, and study materials. Simplify access, save time, and track student engagement.
Most Popular
Contact Sales