Email remains one of the few marketing channels where businesses can communicate directly with customers, control their audience relationships, and connect campaigns to leads, purchases, retention, and revenue.
But the way email performance is measured has changed. Apple Mail Privacy Protection has made open rates less reliable. Gmail, Yahoo, and Outlook have tightened sender requirements. Automation and AI are reshaping workflows, while inbox placement has become a business issue rather than a purely technical one.
This article brings together recent email marketing statistics from original reports, authoritative datasets, and organizations that conducted the research. Each figure includes its data year and source context, so you can interpret it without relying on outdated statistics that have been recycled across the web.
Key Takeaways:
- Open rates are often inflated; track clicks, leads, and revenue instead.
- Automation drives 37% of email sales from just 2% of send volume.
- Nearly 18% of emails never reach the inbox, per 2026 deliverability data.
- SPF, DKIM, and DMARC are now required for high-volume senders in 2026.
- QR codes can turn offline touchpoints into opt-in email subscribers.
- Key email marketing statistics
- Email usage and market growth statistics
- Email marketing benchmarks for 2026
- Email benchmarks by industry
- Email benchmarks by region
- What current data says about email engagement
- When is the best time to send marketing emails?
- Email automation statistics
- Email marketing ROI statistics
- Email client market share statistics
- Email deliverability statistics
- Email sender requirements in 2026
- AI in email marketing statistics
- What these email statistics mean for marketers
- How QR codes can grow an opt-in email list
- Frequently asked questions
- Final thoughts
Key email marketing statistics
The latest data shows that email continues to grow, but sending more messages does not automatically produce stronger results. List quality, relevance, automation, inbox placement, and measurement have a greater influence on performance.
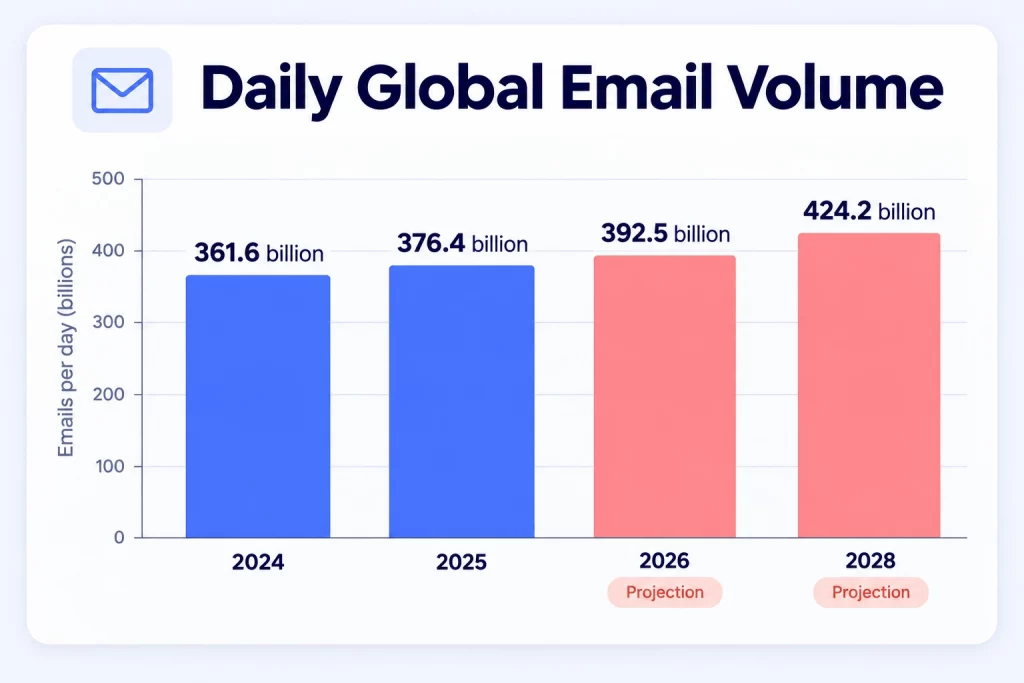
- An estimated 376.4 billion emails were sent and received worldwide each day in 2025. The figure is projected to reach 392.5 billion per day in 2026 and 424.2 billion by 2028. (Statista)
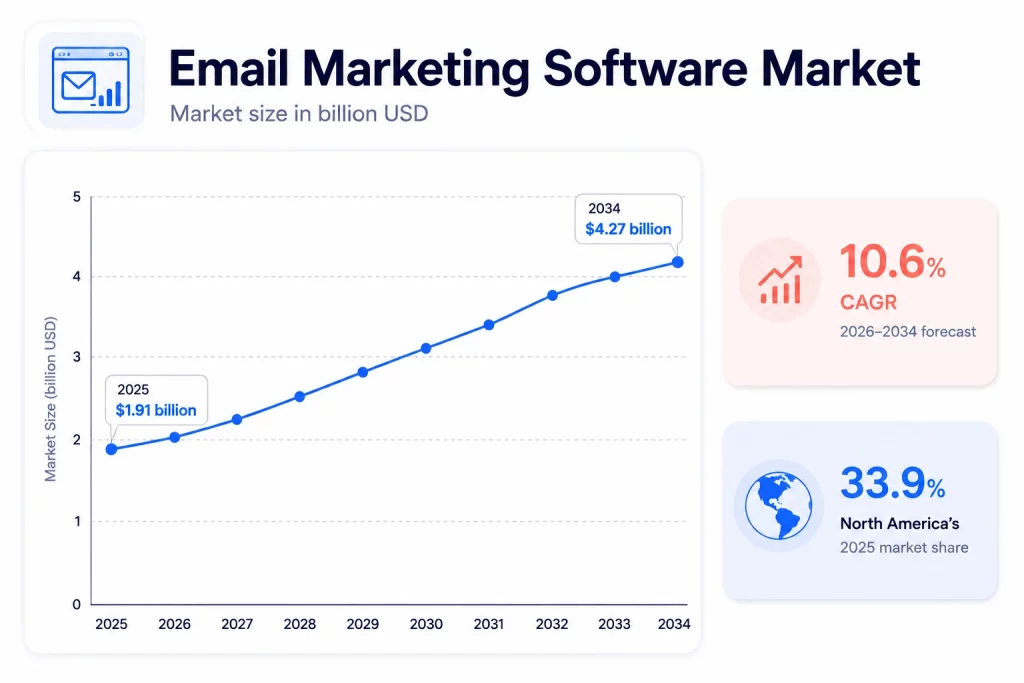
- The global email marketing software market was valued at $1.91 billion in 2025 and is projected to reach $4.27 billion by 2034. (Fortune Business Insights)
- MailerLite reported a 43.46% average open rate and a 2.09% average click rate across more than 3.6 million campaigns sent between December 2024 and November 2025. The average click-to-open rate was 6.81%, while the unsubscribe rate was 0.22% in the same dataset. (MailerLite)
- Automated emails generated 37% of email-driven sales while accounting for just 2% of email volume in Omnisend’s 2024 ecommerce data. (Omnisend)
- Nearly 18% of emails failed to reach the inbox in Sinch Mailgun’s analysis of more than 400 billion emails sent in 2025. (Sinch Mailgun)
- 60% of senders that measure promotional email ROI report returns above $10 for every $1 spent. (Sinch Mailgun)
- 79% of email senders use or plan to use AI in their email programs. (Sinch Mailgun)
- Apple and Gmail accounted for almost 90% of more than one billion tracked email opens analyzed by Litmus in May 2026. (Litmus)
- 78% of surveyed senders say email is critical to business success. (Sinch Mailgun)
Email usage and market growth statistics
Email supports far more than newsletters. Businesses use it for lead nurturing, account alerts, purchase confirmations, onboarding, customer support, event communication, and automated lifecycle campaigns.
Global email traffic continues to rise:
- 361.6 billion emails were sent and received per day in 2024.
- The figure increased to 376.4 billion per day in 2025.
- It is projected to reach 392.5 billion per day in 2026.
- Daily volume is forecast to exceed 424 billion by 2028.
These figures include both personal and business email. They represent messages sent and received per day, not per year. (Statista)
Investment in email technology is also increasing. Fortune Business Insights estimates that:
- The email marketing software market was worth $1.91 billion in 2025.
- It is projected to reach $4.27 billion by 2034.
- The forecast compound annual growth rate from 2026 to 2034 is 10.6%.
- North America represented 33.9% of the market in 2025.
The expansion reflects continued demand for automation, segmentation, analytics, customer lifecycle communication, and AI-supported campaign management. (Fortune Business Insights)
Email marketing benchmarks for 2026
Benchmarks provide context, but they are not universal performance targets. Results vary by industry, audience, geography, list-acquisition method, campaign type, and the platform reporting the data.
MailerLite’s 2026 benchmark report analyzed more than 3.6 million campaigns from over 181,000 approved accounts. The data covers December 2024 through November 2025, and all reported benchmarks are median values.
| Metric | 2025 average benchmark |
|---|---|
| Open rate | 43.46% |
| Click rate | 2.09% |
| Click-to-open rate | 6.81% |
| Unsubscribe rate | 0.22% |
Source: (MailerLite)
These numbers are useful for understanding the broad market, but your most relevant comparison is usually your own performance across similar campaigns.
A promotional campaign, a newsletter, an onboarding email, and an account notification serve different purposes. A campaign with a lower open rate may still be more successful if it produces more purchases, replies, registrations, or qualified leads.
Why open rates need context
Open rates still help identify broad trends, but they no longer provide a precise measure of human engagement.
Apple Mail Privacy Protection can preload email content even before the recipient opens or reads the message. This inflates reported open rates and can also affect open-based segments, send-time analysis, and automations. (Mailchimp)
Real open rates are likely lower than those shown in campaign dashboards because Apple Mail automatically records many messages as opened.
Measure email performance using a combination of:
- Click rate
- Conversion rate
- Revenue per email
- Lead submissions
- Replies
- Unsubscribe rate
- Spam complaint rate
- Bounce rate
- Repeat purchase or retention activity
Email benchmarks by industry
Industry context is more useful than a single global average. The audience for a nonprofit newsletter behaves differently from the audience for a retail promotion or software update.
The following figures come from MailerLite’s 2025 campaign data:
| Industry | Open rate | Click rate |
|---|---|---|
| Nonprofit | 52.38% | 2.90% |
| Health and fitness | 47.81% | 1.45% |
| Consulting | 45.96% | 2.41% |
| Legal | 42.58% | 4.90% |
| Software and web apps | 39.31% | 1.15% |
| Retail | 37.47% | 1.27% |
| Ecommerce | 32.67% | 1.07% |
| Travel and transportation | 30.10% | 1.68% |
Source: (MailerLite)
The highest median open rates were recorded in:
- Religion: 55.71%
- Hobbies: 53.25%
- Nonprofit: 52.38%
The highest median click rates were recorded in:
- Legal: 4.90%
- Manufacturing: 4.22%
- Media: 4.10%
Click-to-open rates also varied widely. Manufacturing recorded a median CTOR of 14.82%, followed by legal at 14.72% and media at 12.92%. Ecommerce recorded a median CTOR of 4.01%.
These differences do not necessarily mean that one industry writes better emails. Campaign purpose, customer intent, sending frequency, device mix, and the number of clickable elements can all affect reported performance.
Email benchmarks by region
Regional comparisons can help international marketers identify broad differences in email behavior. They should still be interpreted cautiously because Apple device adoption, local messaging habits, language, and customer expectations vary by market.
| Region | Open rate | Click rate | Click-to-open rate |
|---|---|---|---|
| Australia | 47.69% | 2.82% | 8.30% |
| Europe | 45.08% | 2.04% | 6.46% |
| US and Canada | 44.49% | 2.14% | 6.73% |
| Africa | 36.53% | 2.29% | 7.82% |
| Asia | 32.54% | 1.23% | 5.21% |
| LATAM | 31.97% | 1.40% | 6.56% |
Source: (MailerLite)
Australia produced the highest median open, click, and click-to-open rates in this dataset. Asia recorded the lowest click rate, while LATAM recorded the lowest open rate.
Higher iPhone adoption in Australia, the US, and Canada may contribute to higher recorded open rates because of Apple Mail Privacy Protection.
[IMAGE PLACEHOLDER 3: Industry and regional benchmarks]
Description: A grouped chart comparing open and click rates for selected industries, with a smaller panel showing regional click rates. Clearly label the source as MailerLite and the data period as December 2024 to November 2025.
Alt text: Email open and click rate benchmarks by industry and region
Expected image name: email-benchmarks-by-industry-region.webp
What current data says about email engagement
Many subject-line and personalization statistics still circulating online come from studies published before privacy changes altered email measurement. Recent data supports a more cautious approach: no single tactic guarantees better performance.
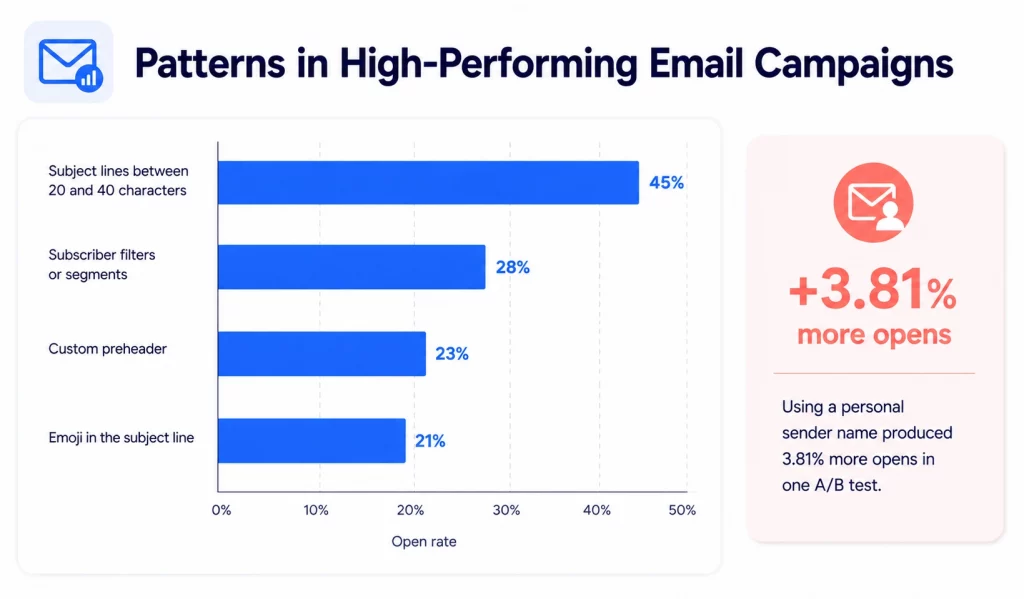
MailerLite’s analysis of high-performing campaigns found that:
- The most-opened campaigns were 45% more likely to use subject lines between 20 and 40 characters.
- They were 28% more likely to use subscriber filters, such as groups or segments.
- They were 23% more likely to include a custom preheader.
- They were 21% more likely to include an emoji in the subject line.
- In one MailerLite A/B test, using a personal sender name produced 3.81% more opens.
These findings show correlations across campaigns rather than guaranteed uplifts. The right subject line, emoji, sender name, or preheader still depends on the audience and message. (MailerLite)
The stronger lesson is that relevance matters more than inserting a name or applying a popular subject-line formula. Good personalization should change the usefulness of the message, recommendation, offer, or timing.
When is the best time to send marketing emails?
There is no single day or hour that works best for every business. Audience routines, time zones, campaign objectives, and email type matter more than broad send-time averages.
MailerLite’s current benchmark guidance points to 3 p.m. to 7 p.m. as a useful window for generating opens. However, send-time findings should be treated as testing hypotheses, especially because open data can be affected by Apple Mail Privacy Protection. (MailerLite)
A better testing process is to compare:
- Recipient-local time instead of the sender’s time zone
- Workday and evening behavior
- B2B and consumer audiences
- Promotional, educational, and transactional emails
- Immediate clicks versus delayed conversions
- Revenue and lead outcomes rather than opens alone
Your own campaign history is more reliable than a universal “best time to send” rule.
Email automation statistics
Automation allows businesses to send messages in response to customer actions instead of relying entirely on scheduled broadcasts. This often puts the email closer to the customer’s moment of intent.
Omnisend’s 2025 ecommerce report found that:
- Automated emails represented only 2% of email volume but generated 37% of email-driven sales.
- One in three people who clicked an automated message made a purchase.
- For scheduled campaigns, the figure was one in 18.
- Abandoned-cart, welcome, and browse-abandonment emails generated 87% of automated orders.
- Back-in-stock emails recorded a 59.19% open rate.
- Back-in-stock emails achieved a 5.34% conversion rate.
- Approximately one in two people who clicked an automated welcome or abandoned-cart email completed a purchase.
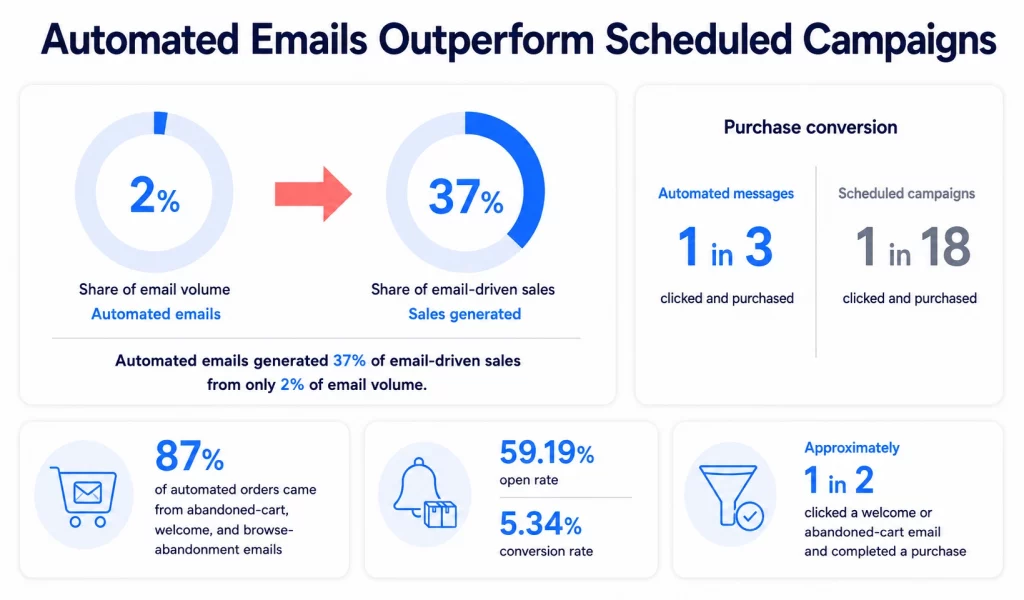
These findings apply specifically to Omnisend’s ecommerce dataset. They should not be treated as universal benchmarks for every industry, but they show the commercial value of timely, behavior-based messaging. (Omnisend)
Useful automation workflows include:
- Welcome and onboarding sequences
- Lead follow-up
- Browse and cart abandonment
- Event reminders
- Back-in-stock alerts
- Post-purchase education
- Review and feedback requests
- Renewal reminders
- Re-engagement campaigns
Email marketing ROI statistics
Email can generate substantial returns, but no single ROI figure applies to every organization. Results depend on the type of email, attribution method, customer value, operational costs, and the business’s ability to connect messages to outcomes.
Sinch Mailgun’s 2026 Email Impact Report found:
- 46% of senders can measure promotional email ROI.
- Among those that measure it, 60% report more than $10 for every $1 spent.
- 13% report promotional email returns above $40 for every $1 spent.
- 43% of senders can measure transactional email ROI.
- Among those senders, 62% report returns above $10 for every $1 spent.
- 14% report transactional email returns above $40 for every $1 spent.
- 78% of respondents say email is very or extremely important to organizational success.
The report is based on a global survey of more than 1,200 email senders. (Sinch Mailgun)
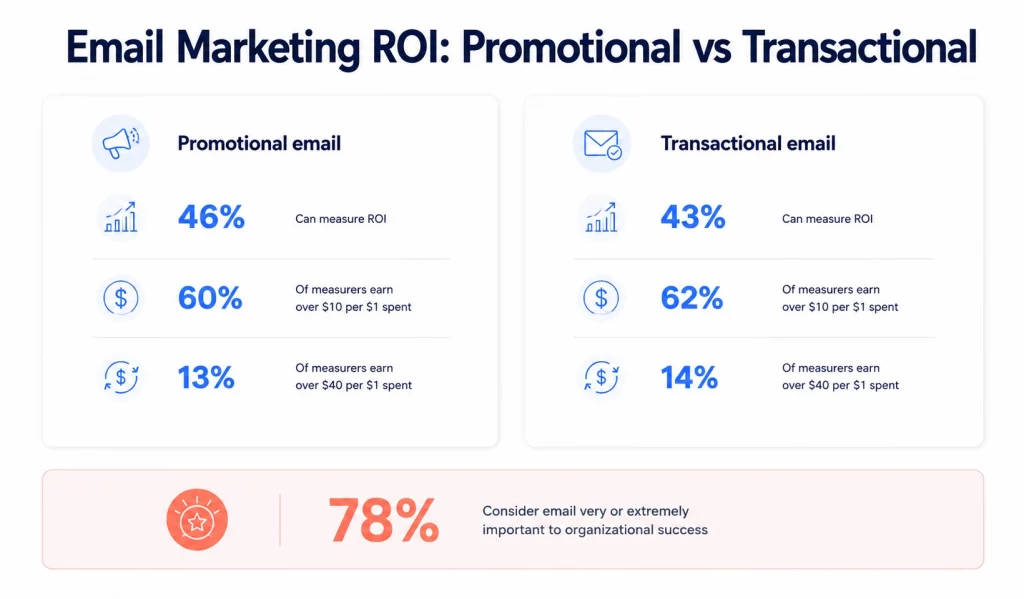
The findings show that strong returns are possible, but many teams still cannot measure them confidently.
A useful email ROI calculation should consider:
- Email platform and infrastructure costs
- Content, design, and campaign production
- List acquisition and data-management costs
- Revenue directly attributed to email
- Email-assisted conversions
- Leads generated or advanced
- Repeat purchases and retention
- Transactional email’s role in reducing support or operational costs
Email client market share statistics
Emails can look and behave differently across Apple Mail, Gmail, Outlook, Yahoo Mail, mobile apps, and desktop clients. This makes email-client testing an important part of campaign quality control.
Litmus analyzed more than one billion tracked opens in May 2026 and reported:
| Email client group | Share of tracked opens |
|---|---|
| Apple | 64.66% |
| Gmail | 24.11% |
| Outlook desktop | 6.49% |
| Yahoo Mail | 2.57% |
| Google Android | 1.38% |
| Outlook.com | 0.38% |
Apple and Gmail together accounted for nearly 90% of tracked opens. (Litmus)
These figures represent shares of tracked opens, not the percentage of individual people using each service. Apple’s figure includes privacy-affected opens that Litmus does not consider reliable indicators of genuine viewing.
The practical takeaway is to test important campaigns across the environments your subscribers actually use, while paying particular attention to:
- Mobile layouts
- Dark mode
- Readable text sizes
- Tappable buttons
- Image blocking
- Descriptive alt text
- Accessible color contrast
- Layouts that remain understandable without images
Email deliverability statistics
Email cannot generate clicks, leads, or revenue if it does not reach the inbox. Deliverability therefore affects both campaign performance and customer experience.
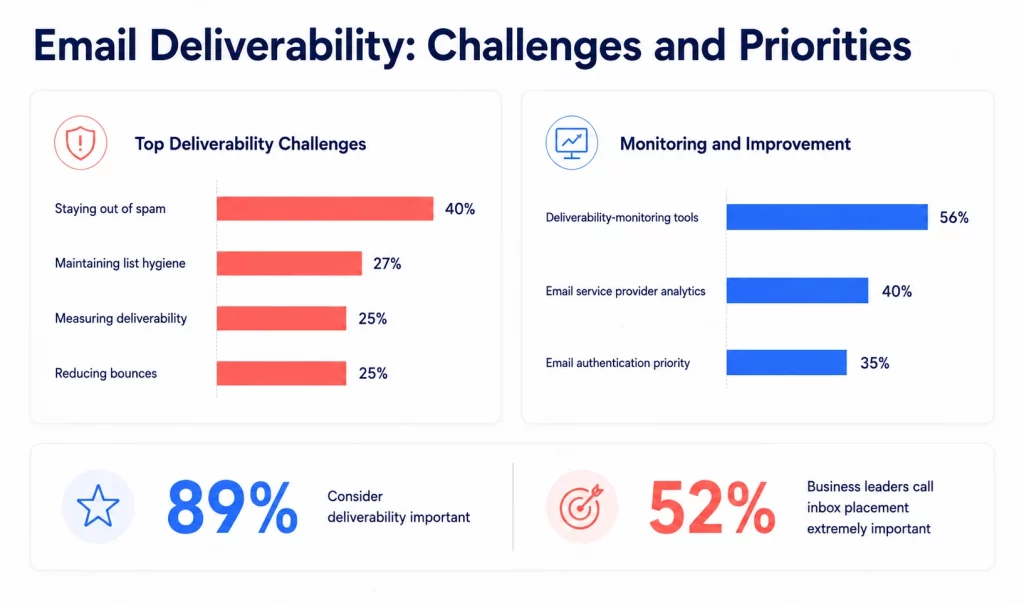
Sinch Mailgun’s 2026 report combines a survey of more than 1,200 senders with insights from over 400 billion emails sent in 2025. It found that nearly 18% of emails failed to reach the inbox. (Sinch Mailgun)
The same research found:
- 89% of senders consider deliverability important to their organizations.
- 52% of business leaders describe inbox placement as extremely important.
- 43% say their ability to reach the inbox improved over the previous 12 months.
- 40% identify staying out of spam as a major deliverability challenge.
- 56% use dedicated deliverability-monitoring tools.
- 40% rely on analytics from their email service provider.
- 35% identify email authentication as a top inbox-placement priority.
- 51% of senders using DMARC enforce a quarantine or reject policy.
- 27% identify list hygiene as a major challenge.
- 25% struggle to measure deliverability.
- 25% identify reducing bounces as a challenge.
(Sinch Mailgun Deliverability Report)
Delivery rate and inbox placement are different
A message counted as delivered may still be filtered into spam.
Sinch Mailgun found that only 12% of senders in its earlier research correctly understood that delivery rate measures messages accepted into any folder, including spam. In the 2026 survey, 36% of senders said they monitor a “deliverability rate,” even though no universal deliverability-rate metric exists.
For clearer reporting, distinguish between:
- Delivery rate: The percentage accepted by receiving mail servers.
- Inbox placement: The percentage likely to reach the inbox or a legitimate tab such as Gmail Promotions.
- Bounce rate: The percentage rejected by receiving servers.
- Spam complaint rate: The percentage reported as unwanted by recipients.
- Engagement: What recipients do after the message arrives.
[IMAGE PLACEHOLDER 6: Delivery versus inbox placement]
Description: A funnel showing messages sent, accepted by the receiving server, placed in the inbox or Promotions tab, filtered to spam, bounced, or missing. Make it clear that server acceptance does not guarantee inbox placement.
Alt text: Difference between email delivery, inbox placement, spam filtering, and bounced messages
Expected image name: email-delivery-vs-inbox-placement.webp
Email sender requirements in 2026
Mailbox providers now enforce authentication and unsubscribe requirements more strictly. These requirements matter more to long-term performance than most subject-line tactics.
Google requires all senders to personal Gmail accounts to authenticate messages using SPF or DKIM. Senders delivering close to 5,000 or more messages per day must meet additional requirements, including:
- SPF and DKIM authentication
- DMARC authentication
- Alignment between the visible From domain and authenticated domain
- TLS transmission
- Valid forward and reverse DNS records
- One-click unsubscribe for subscription messages
- A visible unsubscribe option in the email
- Spam rates below Google’s required threshold
Google says noncompliant messages may be rejected or delivered to spam. Enforcement increased further from November 2025. (Google email sender guidelines) (Google sender guidelines FAQ)
Yahoo also advises senders to use SPF, DKIM, and DMARC, send only to people who requested the messages, honor expected sending frequency, and avoid purchased lists or preselected opt-in boxes. (Yahoo Sender Hub)
Microsoft introduced mandatory SPF, DKIM, and DMARC requirements for domains sending more than 5,000 messages per day to Outlook.com consumer accounts. (Microsoft’s high-volume sender requirements)
Authentication is therefore a mailbox-provider requirement for high-volume senders, not simply an optional deliverability improvement.
AI in email marketing statistics
AI is becoming common in email workflows, but many teams still use it mainly for content generation rather than optimization, segmentation, or deliverability.
Sinch Mailgun’s 2026 survey found:
- 79% of senders use or plan to use AI in their email programs.
- 60% already use AI at least some of the time.
- 27% use AI regularly.
- Among high-volume senders, 74% use AI at least sometimes.
- 35% of high-volume senders use AI regularly.
- 46% of AI users say it improves speed and efficiency.
- 41% use AI to generate email copy.
- 37% use it for subject-line optimization.
- 36% use or plan to use AI for content personalization.
- 29% use it to create dynamic content.
- 27% use it for send-time optimization.
- 27% use it to access or analyze email data.
- 24% use it for predictive analytics.
- 22% use it to support A/B testing.
- 21% use it for list segmentation.
- 23% say AI has not improved their email programs.
- 21% have no plans to use AI for email.
(Sinch Mailgun AI and email report)
AI can help teams work faster, but faster production does not automatically create stronger campaigns. Content still needs human review for accuracy, relevance, tone, brand consistency, and customer value.
What these email statistics mean for marketers
The value of a benchmark depends on whether it improves a decision. The strongest email programs do not chase every industry average. They use benchmarks to identify questions, then validate the answers against their own data.
Measure action, not opens alone
Use open rate as a directional signal. Give more weight to clicks, replies, lead submissions, purchases, renewals, and revenue.
Avoid triggering important workflows only because someone did or did not open a message. Privacy-generated opens can make both conditions unreliable.
Automate moments with clear intent
Welcome emails, abandoned-cart reminders, event follow-ups, and back-in-stock alerts work because a customer action creates a relevant reason to send the message.
Start with a few high-value workflows rather than automating every possible interaction.
Protect list quality
A large list full of inactive, purchased, or poorly consented contacts creates more risk than value.
Use clear opt-ins, validate addresses where appropriate, remove repeated bounces, monitor complaints, and make unsubscribing easy.
Compare similar campaigns
Compare promotional emails with other promotions, onboarding emails with other onboarding messages, and regional campaigns with relevant regional benchmarks.
A campaign with a lower open rate can still be the stronger campaign if it produces more qualified leads or revenue.
Connect reporting to business outcomes
Track how many recipients:
- Submit a lead form
- Register for an event
- Request a demo
- Complete a purchase
- Renew or upgrade
- Download a resource
- Reply to the campaign
- Return for another purchase
This makes email easier to evaluate as a business channel rather than a collection of engagement percentages.
How QR codes can grow an opt-in email list
Email benchmarks assume that the business has an engaged, permission-based list. But many potential subscribers interact with brands offline through packaging, events, receipts, brochures, counters, product displays, and direct mail.
A QR code can connect these physical touchpoints to a mobile email signup form. Instead of asking someone to type a long URL, businesses can let them scan and opt in while their interest is still fresh.
QRCodeChimp’s Form QR Code lets businesses create mobile-friendly forms for newsletter signups, lead capture, event registration, surveys, warranty registration, and customer feedback. Submitted responses are available in the QRCodeChimp dashboard and can be exported for follow-up and analysis.
Because the form is connected to a dynamic QR code, businesses can update the form after printing without replacing the QR code. Scan and form analytics also help compare activity across packaging, stores, events, or campaign materials.
Use a separate QR code for each important placement when you need to distinguish results by location, material, or campaign.
An Email QR Code serves a different purpose. It opens the user’s email application with the recipient, subject line, and message content prepared. It can support inquiries, applications, RSVPs, and customer support, but it does not automatically subscribe the person or record marketing consent.
Use a Form QR Code or an opt-in landing page when email list growth is the goal.
Best practices for collecting email signups with QR codes
Keep the signup form short and explain what the subscriber will receive. Ask only for information you need to deliver the promised content or offer.
Place the QR code close to the moment of interest:
- Add it to product packaging for product tips or replenishment reminders.
- Display it at an event booth for resources and follow-up.
- Place it on a counter card for loyalty or offer signups.
- Add it to a brochure so readers can continue the conversation later.
- Use distinct QR codes across stores or events to compare performance.
Test the complete experience before printing. The QR code should scan reliably, the form should load quickly on mobile, and the confirmation page should clearly explain what happens next.
Final thoughts
Email remains a high-value marketing and customer-communication channel, but the strongest programs use a different playbook from the one reflected in many older statistics pages.
Open rates are directional rather than definitive. Authentication and easy unsubscribing are mailbox-provider requirements for high-volume senders. Automated emails can convert customer intent into action, and deliverability affects revenue before a recipient ever sees the message.
The common foundation is list quality. Businesses perform better when subscribers know what they signed up for, messages arrive at relevant moments, and campaign reporting connects engagement to leads, purchases, retention, and revenue.
QR codes can extend this strategy into physical customer touchpoints. By connecting packaging, stores, events, receipts, and print materials to an opt-in form, businesses can turn offline interest into measurable first-party relationships.
Frequently asked questions
What is a good email open rate in 2026?
MailerLite reported a median open rate of 43.46% across more than 3.6 million campaigns sent between December 2024 and November 2025. Industry medians ranged from 30.10% to 55.71%. Open rates can be inflated by Apple Mail Privacy Protection, so evaluate them with clicks, conversions, replies, and revenue.
What is a good email click-through rate?
The median email click rate was 2.09% in MailerLite’s 2025 dataset. Industry figures ranged from 0.83% in politics to 4.90% in legal. Your target should reflect your industry, campaign type, audience, and number of clickable links.
What is a good click-to-open rate?
MailerLite reported a median CTOR of 6.81%. Industry figures ranged from 2.96% to 14.82%. Because CTOR relies on reported opens, Apple Mail Privacy Protection can make it appear lower than the true rate.
Is email marketing still profitable?
Yes, for many organizations. Sinch Mailgun found that 60% of senders measuring promotional email ROI reported more than $10 for each $1 spent, while 13% reported returns above $40 for each dollar. However, less than half of senders said they could measure promotional email ROI.
Do automated emails perform better than scheduled campaigns?
In Omnisend’s ecommerce dataset, automated emails generated 37% of email-driven sales from 2% of email volume. One in three people who clicked an automated message purchased, compared with one in 18 for scheduled campaigns. These figures are ecommerce-specific, but they demonstrate the value of timely, behavior-based messages.
What is the difference between email delivery and deliverability?
Delivery means that the receiving server accepted the message. The email may still be filtered into spam. Deliverability describes the broader ability to reach the intended inbox, which usually requires monitoring sender reputation, authentication, engagement, and inbox-placement tests.
How can I grow my email list offline?
Place Form QR Codes on packaging, receipts, signage, brochures, direct mail, and event materials. A scan opens an opt-in form on the customer’s phone. Use separate QR codes for different placements when you want to compare scans and submissions by source.
You may also like
First-Party Data Statistics 2026: Adoption, ROI, Privacy, and Collection Trends
Discover the critical aspects of first-party data statistics. Learn how to use them to create personalized marketing campaigns and enhance customer experiences.
QR Code Statistics for 2026: Usage, Market Growth, Payments, and Business Trends
The QR code landscape has changed significantly over the past few years, especially after the pandemic. We’ve compiled some QR code statistics and forecasts to help you better understand the usage and potential of QR codes.
Digital Business Card Statistics in 2026: Usage, Applications, Adoption, and Top Players
Discover some important statistics for digital business cards, including the market size of digital business cards, along with their key drivers, how people use them, and much more.
Top 11 Marketing Assets Every Reseller Needs to Close More Deals in 2026
Discover 11 essential marketing assets every reseller needs in 2026 to build trust, boost credibility, and close more deals faster than ever.
Most Popular
Contact Sales